One of the most common questions we get is: How many pages will my ink or toner cartridge print? And the answer always involves the magic phrase 5% page coverage—but what does that actually mean? Let’s dive in!
Where did 5% page coverage come from?
The International Organisation for Standardization (ISO) came up with the 5% page coverage measurement so ink and toner manufacturers could fairly state how long their cartridges last.
To determine page yield, cartridges are tested under strict lab conditions using an official test document packed with a mix of text and graphics. The printer chugs along until the cartridge runs dry, and the total number of pages printed becomes the official page yield you see on our site.
Key ISO Standards for Page Yield Measurement:
• Inkjet (black & colour): ISO/IEC 24711
• Mono laser printers: ISO/IEC 19752
• Colour laser printers: ISO/IEC 19798
Interesting fact: There's no standard for photo printing, and the documents they print includes no photo. This is why you'll never find a photo cartridge with a yield, as their life depends entirely on how ink-hungry your snaps are!
What do these 5% standards tell you?
When we talk about 5% page coverage, we mean that only 5% of the page is covered in ink or toner. To put it into perspective, that’s roughly half a page of standard-sized text (think Arial 12pt). If your prints are full of bold headlines, images, or chunky paragraphs, your actual page coverage will be way higher—and your cartridge will run out faster.
This standardisation is actually super helpful. Before ISO testing, printer brands each did their own thing, making cartridge comparisons a nightmare. Now, thanks to the ink overlords at ISO, you can easily compare running costs between brands.
Example:
If an HP cartridge is rated for 500 pages at 5% coverage and costs £10, while an Epson cartridge also prints 500 pages but costs £5, you know Epson is giving you double the value. Winner winner, inkjet dinner.
How to measure the page coverage of what you print
There's good software on the internet that will enable you to calculate page coverage, particularly handy if you print the same kind of document every day. We're fans of AVPsoft. Using it, we tried various common fonts to see the difference font can make in 5% coverage...
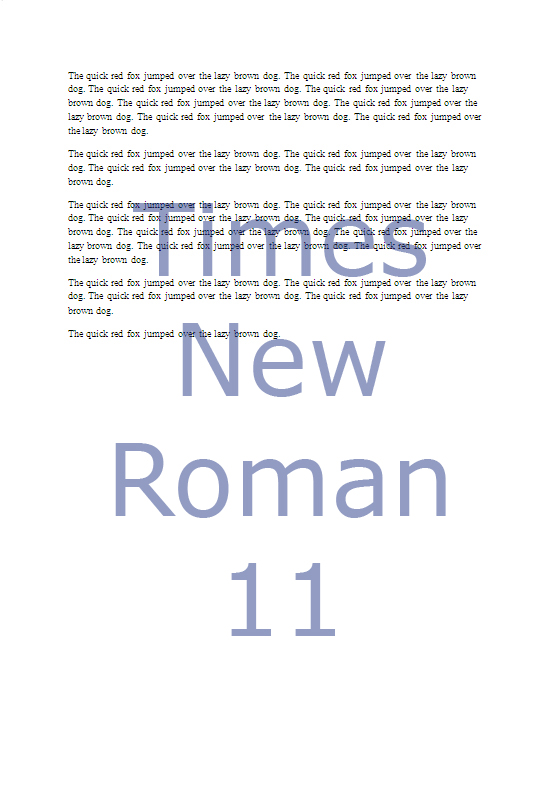
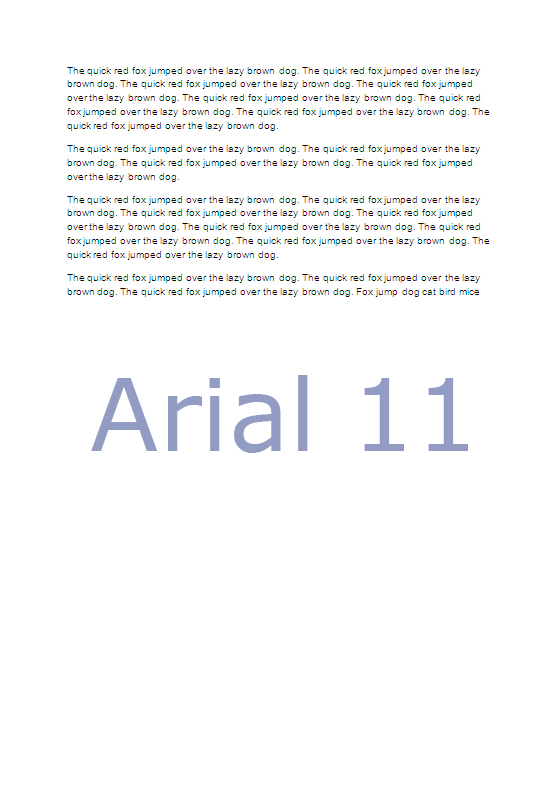
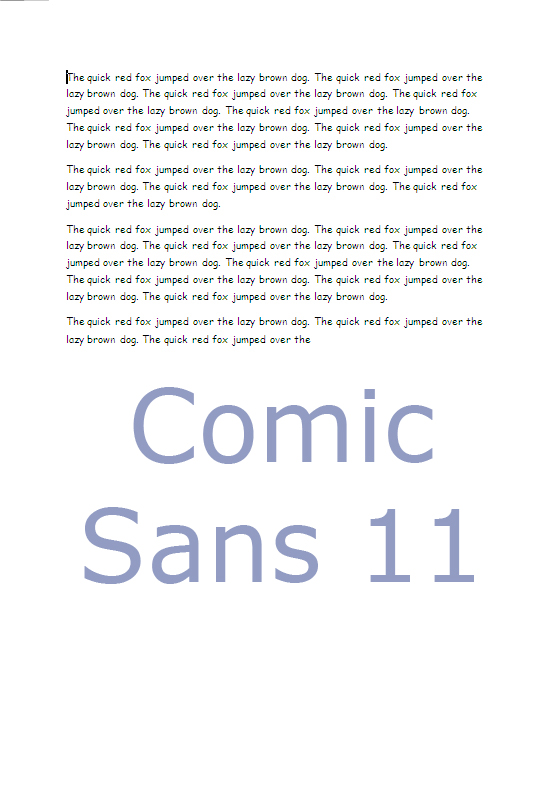
To make sure results were consistent, we used the same sentence repeated as many times as necessary (The quick brown fox jumped over the lazy brown dog). This means that a standard sheet of five percent is in the region of half a page of normal sized text.
Which font can give you more for your 5%
The previous images highlight the difference fonts make in yield, and when you combine it with different font sizes it makes even more of a difference. We looked at Times New Roman, Arial and Comic Sans for everyday use, and compared them with Calibri and Tahoma below:
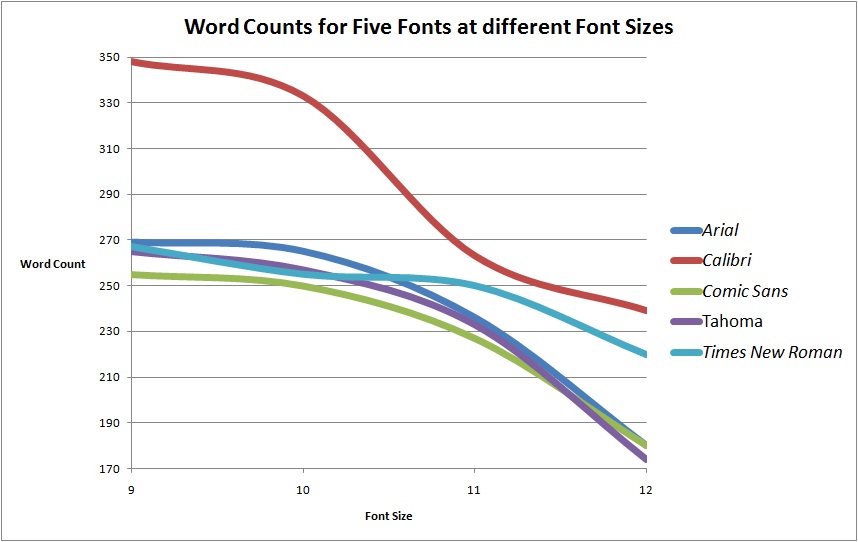
Font Coverage Results:
• Calibri (Microsoft Word’s default) was the ink-saving champion. Bravo.
• Arial, Comic Sans, and Tahoma all guzzled ink at about the same rate.
• Times New Roman was a wildcard—going from size 10 to 11 barely changed its ink usage, making it a sneaky good choice for larger text.
Final Thoughts
The 5% page coverage standard is useful for comparisons, but real-world printing is never that neat. If you print emails, invoices, or essays, you might get close to the rated yield. But if you’re printing flyers, spreadsheets with borders, or bold, chunky text, expect to burn through ink or toner much faster.
By understanding how page coverage works, you can make smarter cartridge choices, save money, and stretch your ink further—because nobody likes running out of ink mid-print-job (or paying more than they have to). And hey, if you ever need top-quality, reasonably priced ink, you know where to find us...
